DASHBOARDS
Standardized View Across Your Jobs
Anterra’s customizable Construction Project Dashboards and Construction Financial Dashboards provide real-time project tracking based on your KPIs to enhance decision-making and drive business success!
Unlock Analytics Beyond Your Financial ERP’s Limitations
Hundreds of Widgets Drillable to Transaction Level
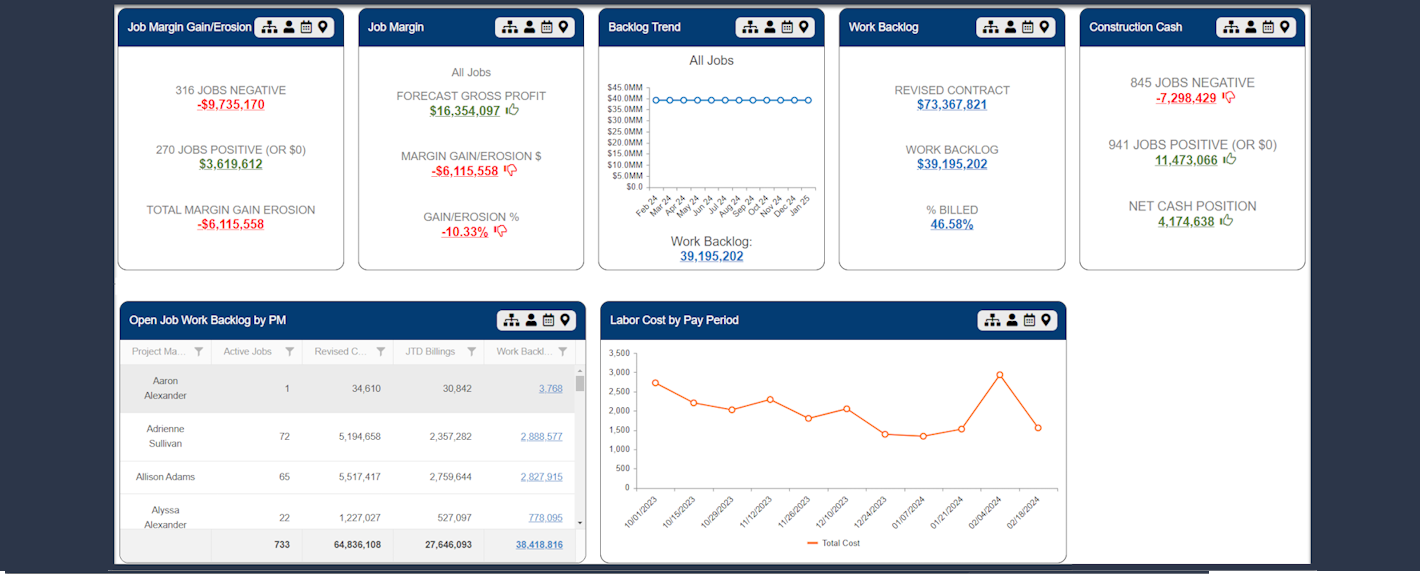
Monitor Job Margin, Fade/Gain, Cash Position, Labor Rate Variance, Procurements, and more…

kpis for construction
Empower PMs & Executives with Real-Time Insights & Analytics
![]() Customization
Customization
Mix pre-built and self-built widgets to tailor the dashboard to your specific needs and preferences.
![]() User Role-Based Security
User Role-Based Security
Widgets populate based on security-role profiles.
![]() Comprehensive Analytics
Comprehensive Analytics
Widgets designed for construction, finance, and service management give a holistic view of the business in a unified platform.
![]() Collaborate — or Not!
Collaborate — or Not!
Share dashboards for a consistent view across the team or create individual dashboards for private management.
Watch Now
Dashboards
Build Your Own Construction Dashboards
Build your own custom construction project management dashboard with real-time insights and monitor essential KPIs
- Dashboards contain graphs and tables for key performance indicators (KPIs) not available in your Accounting system of record
- Monitor job margin Gain/Fade, job cash position, labor rate variance, remaining to procure, and other key risks in construction
- Create shared Dashboards to provide a consistent and standard way of looking at the business
- User-built dashboards “My Dashboards” based on reporting needs and information available to users through security setup
- Integration with Procore: Integrate data from Procore and your job cost accounting system for a holistic view of project progress and finances.
Construction dashboards can combine information from your job cost accounting system and Procore. Dashboard security can also be set by PMs so they only see their jobs.

Dashboards can be filtered by:
- Company/Division
- Project Manager
- Date
- Job
Clients’ Favorite Widgets
* Financial Widgets in Green | Construction Widgets in Yellow *
AP Trend
Work Backlog
Cash Balance
Cash Trend
Monthly & Cumulative Revenue Report
Job Cost Status
AR Trend
Construction Cash
Job Cash Position
Labor Hours by Pay Period
WIP Management Automation
Job Margin Gain/Erosion
Purpose of Construction Project Management & Financial Dashboards
Construction project management and financial dashboards centralize all project and financial data, providing a unified view of project status and financial health. This centralization helps in monitoring progress, identifying bottlenecks, and ensuring efficient resource allocation.
Real-Time Monitoring
These dashboards offer real-time insights into key performance indicators (KPIs) such as job margin, cash position, labor rate variance, and procurement status. Real-time data access allows project managers to make informed decisions quickly and effectively, improving overall project outcomes.
Enhanced Decision-Making
By visualizing critical data points, construction project dashboards facilitate better decision-making. Project managers and executives can assess project performance, adjust timelines, reallocate resources, and address potential risks proactively.
Streamlined Reporting
Financial dashboards automate the generation of financial reports, reducing the manual effort and minimizing errors. This automation ensures that financial data is accurate and up-to-date, enabling more efficient financial management and compliance with industry standards.
Improved Collaboration
Dashboards provide a platform for enhanced collaboration among team members and stakeholders. Shared access to critical project and financial data ensures that everyone is on the same page, improving communication and coordination across the organization.
Customizable Views
Construction project management and financial dashboards can be customized to display the most relevant information for different users. Whether you need a high-level overview or detailed analysis, the dashboards can be tailored to meet specific needs, providing users with access to the data that matters most to them.
By incorporating these features, construction project management and financial dashboards become indispensable tools for enhancing construction processes, improving financial accuracy, and supporting informed decision-making.
Get a Free Demo
Get a live, one-on-one demo with an Anterra Senior Consultant.