Construction and real estate projects don’t pause just because your reporting is stuck in last month’s numbers.
Costs shift daily, project managers want answers yesterday, and CFOs can’t afford to make decisions based on stale data.
And it’s not like Sage 300 CRE lacks the data in need. No, it holds a wealth of information. But getting that info into a usable format often takes hours of manual work, custom reports, or endless spreadsheet gymnastics.
The right BI tool for Sage 300 CRE can help you escape this hassle forever.
In this article, you’ll explore five of the best BI software options compatible with Sage 300 CRE.
Read on and find the right fit for your team.
Best 5 BI Tools for Sage 300 CRE
1. Anterra
Anterra Technology is an Authorized Sage 300 CRE Development Partner that provides dashboards and data warehouse solutions for construction and commercial real estate companies.
It’s a reliable choice for many teams when they are selecting BI software for Sage 300 CRE, thanks to its main product, AnterraBI.
AnterraBI is an enterprise-grade, cloud-based business intelligence and financial reporting platform specifically made for Sage 300 CRE users.
The tool organizes and presents information so you can immediately spot which jobs are healthy, which ones need attention, and where to focus your team’s efforts.
AnterraBI comes ready on day one. The finance module alone gives you immediate insight into current and historical job margins, plus forecasting tools that help you stay proactive.
And with integrated collections, service management, and a Tableau module, you can go beyond standard construction reporting by blending ERP data with spreadsheets and other sources for deeper analysis.
Introduction to AnterraBI™
Construction BI with Anterra
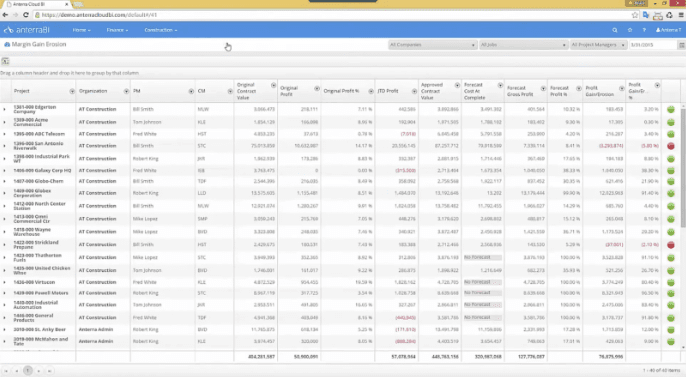
AnterraBI’s construction project dashboard consolidates vital KPIs into one place with drill-through access to more detailed reports.
Some of these construction KPIs include:
- Work backlog and trends
- Job cash positions
- Remaining commitments
- Active job margin percentages
In addition, there are margin reporting tools that highlight where profits are growing or eroding across job types, divisions, or project managers.
Real Estate BI with Anterra
For real estate companies, Anterra groups properties into portfolios and provides dashboards that are intuitive and accessible on any device.
With a simple click, the AR dashboard lets you:
- Track accounts receivable over time
- Analyze aging by property
- Quickly review month-end balances
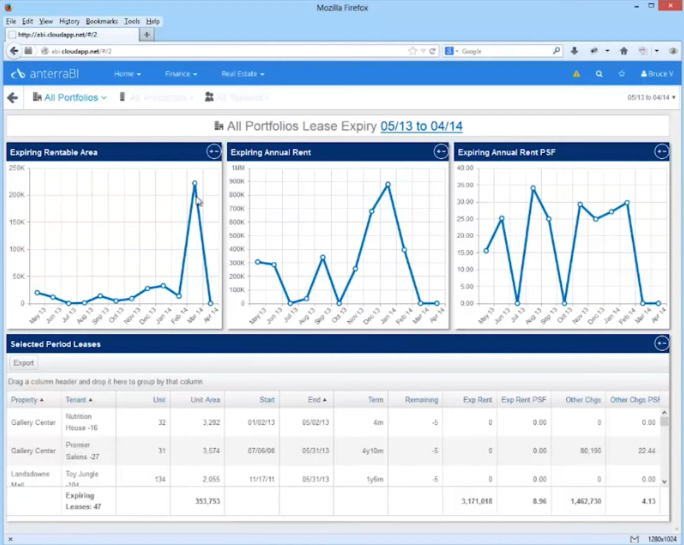
To help you plan the next two years, lease expiry reporting shows you:
- Upcoming expirations
- Rent details
- Portfolio exposure over any chosen time frame
The occupancy dashboard maps your properties geographically and color-codes them by vacancy tolerance so you can see portfolio health at a glance and drill into property-level details instantly.
2. Phocas
Phocas is an all-in-one platform for business intelligence (BI), financial planning and analysis (FP&A), and reporting.
It originated in 2001 as a BI-focused software and services company.
Its platform includes four primary products, namely:
- Analytics
- Budgets and Forecasts
- Financial Statements
- Rebates
Out of these four, Analytics is Phocas’s main offering.
This module provides ad hoc queries, dashboards, and reporting solutions for ERPs like Sage 300.
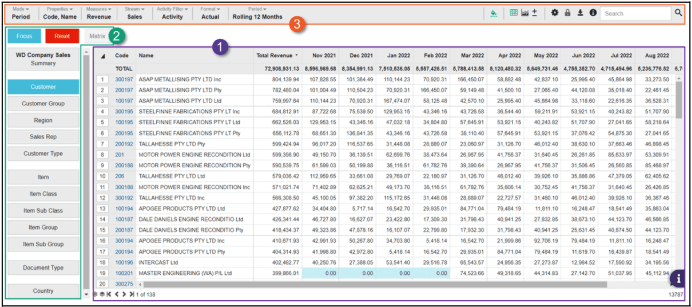
This module is also where most operational analysis takes place, and it has three main elements:
- Grid: Grid is the area for analyzing data. It shows an aggregated summary and updates dynamically as you drill down. A status bar above the grid records every filter, custom period, or selection applied during the session and makes it easy to retrace steps or verify the context of your analysis.
- Dimensions and related actions: The left-hand panel lists available dimensions, such as Sales Rep or Product Class, which can be added to the grid for deeper segmentation. Buttons above the list let you focus on specific entities, reset the view, switch to matrix mode, or return to the high-level summary.
- Toolbar: You can find the toolbar at the top. The toolbar provides controls to change how data appears in the grid. You can adjust visible properties and measures, set time periods, and apply different modes to view predefined column arrangements.
3. Insightsoftware
Insightsoftware calls itself a tool that simplifies reporting and planning processes for the office of the CFO.
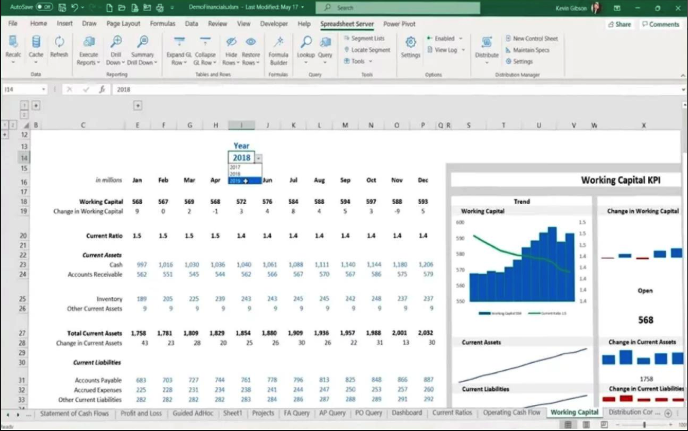
One of its main products is Spreadsheet Server, which delivers real-time data directly within Microsoft Excel.
Traditional ERP systems are built primarily to collect data rather than to report on it, which often leaves finance teams relying on manual exports and complicated workarounds.
Spreadsheet Server tries to remove this hurdle by allowing users to refresh data instantly, drill into details, and combine information from multiple platforms, both general ledger and non-general ledger sources, without leaving Excel.
Alongside Spreadsheet Server, Insightsoftware also offers Bizview, which is a web-based budgeting, planning, and forecasting solution.
Bizview consolidates data from multiple sources into a single planning database to ensure consistent information for analysis while supporting data governance practices.
This is what Bizview provides:
- Centralized data management through integrated and secure data storage to maintain accuracy and compliance.
- Flexible modeling and dashboards with a drag-and-drop interface with tools for top-down, bottom-up, driver-based, what-if, and zero-based planning.
4. Procore
Procore is a cloud-based construction management platform that sees wide adoption across the construction industry.
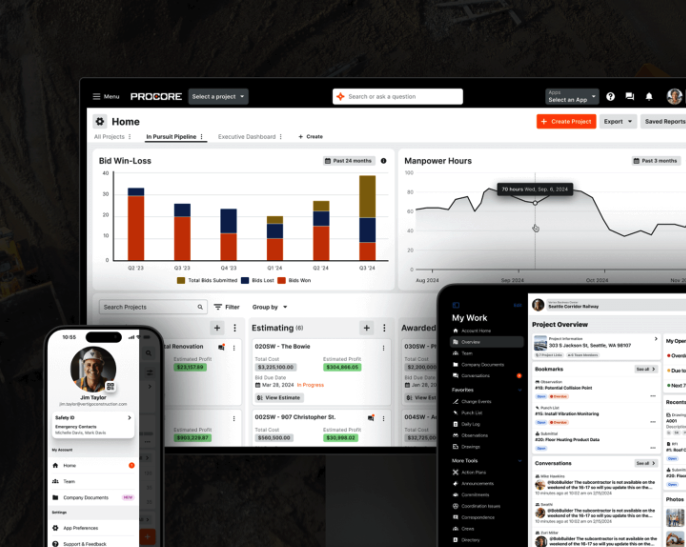
It offers a business intelligence layer built with Power BI called Procore Analytics.
This BI layer has a collection of more than 100 standard dashboards and reports and the option to create custom reports.
Some of Procore Analytics’ capabilities are as follows:
- Lets you view detailed reports directly in Power BI Desktop, the Power BI service, or within Procore using the embedded app.
- With Procore Data Extract, you can consolidate project data into a ready-to-use Microsoft Azure SQL database.
- You can highlight project metrics relevant to stakeholders through customized reporting tools.
The syncing between Procore and Sage 300 CRE can be bi-directional, meaning budgets can originate in either system and then be shared across both. Here are the two directions in question:
- Procore to Sage 300 CRE: Here, you build the budget in Procore and export it to Sage 300 CRE.
- Sage 300 CRE to Procore: Here, you build the budget in Sage 300 CRE and import it into Procore.
5. Prophix
Prophix is a centralized FP&A platform that integrates data from more than 200 sources, including commonly used construction ERPs such as:
- Viewpoint Vista™
- Spectrum®
- Sage CRE
- Coins
- JD Edwards
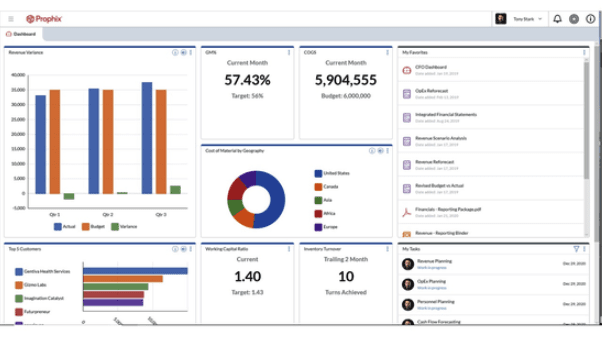
All its reporting and analysis take place within a single interface where users can view dashboards, generate summary reports, run ad-hoc analyses, or drill into detailed data as needed.
Its dashboards and reports update automatically based on a particular schedule or through manual refresh to ensure decisions are always based on current information.
Each user receives a personalized dashboard containing charts, graphs, and KPIs (or whatever data visualization method relevant to their role).
For example, a CFO can monitor financial performance indicators such as inflows and outflows, cost variance, and working capital, while a project manager can track cost trends and labor efficiency.
Prophix’s FP&A Plus system deals with work-in-progress (WIP) reporting which has a high report generation speed and responsiveness even when working with large datasets.
Prophix also supports real-time detection of margin fade. If a project begins to lose profitability, users can quickly identify the affected phase, isolate the root cause, and drill down for details using simple drag-and-drop actions with filtering and review options.
Let’s point you in the right direction
For many construction CFOs, Sage 300’s business intelligence tools alone are enough.
However, doing that job like a pro still needs integration with 3rd party BI software.
Anterra Technology is your go-to BI software for Sage 300 CRE that does its thing without disrupting the systems your team already knows.
With this integration, you skip months of retraining and risky migrations while gaining instant clarity and faster insights.
See how far Sage 300 CRE can take you with the right BI software. Sign up for an Anterra demo today.
