The Office of the CFO report 2025 by Pigment finds that 89% chief finance officers (CFOs) are still lacking accurate or complete data to base their decisions on.
The major reason is manual data entry, which is fraught with the risk of errors. This also causes CFOs to spend most of their time looking for information living inside siloed spreadsheets.
What can put an end to all such CFO woes is the right dashboard software that could consolidate data from all departments and paint an accurate financial picture.
In this article, you’ll explore top construction CFO dashboards & reports and the financial KPIs that they commonly track. You’ll also learn how you can create custom construction dashboards with AnterraBI.
Let’s start by introducing you to the benefits of construction CFO dashboards.
Benefits of the Construction CFO Dashboard and Reports
Below you’ll find four major benefits of having a construction dashboard and reports for CFOs.
1. Unified Real-Time Visibility
In construction, the gap between the field and the office is what often causes loss of profitability.
The teams operate in isolation, which creates information silos. And information silos are a recipe for disasters and delays, which bring with them disputes and finger-pointing.
CFO dashboards dismantle these silos. By pulling and reporting information from all departments in a single pane, they create a single source of truth for the entire organization.
When the entire organization works with the same data, coordination improves and miscommunications decrease, naturally.
And since dashboards update information on a real-time basis instead of monthly, executives can intervene early on under performing projects and course correct.
2. Proactive Forecasting
CFO dashboards & reports also eliminate the need for relying on human intuition for projecting future outcomes.
With the continuous stream of live data coming from job sites, you can predict each project’s final profitability long before the final invoice.
Dashboards also allow you to model what-if scenarios to predict the impact of risky decisions and opportunities.
3. Streamlined Compliance
The construction industry is fraught with complex compliance requirements, and responding to it with manual data handling has a high risk of errors and omissions.
With the automated tracking and reporting of dashboards, the risk of costly compliance violations and penalties drastically reduces.
A CFO dashboard also prepares organizations for sudden audits as project and financial KPIs are easily traceable, and all that’s left to do is generate reports.
4. Fast Data-Driven Decision Making
CFO dashboards shrink the time between identifying drops, spikes, or opportunities and taking appropriate actions.
This also allows for more precise and competitive bids because you have historical data on similar projects at your fingertips.
CFO Dashboard KPIs
What CFO metrics should go in a dashboard varies from company to company.
But there’s a set of KPIs that are commonly found in most CFO dashboards & reports.
7 Top Construction CFO Dashboards and Reports
Here are seven of the main dashboards that are extremely important for construction CFOs to have by their sides.
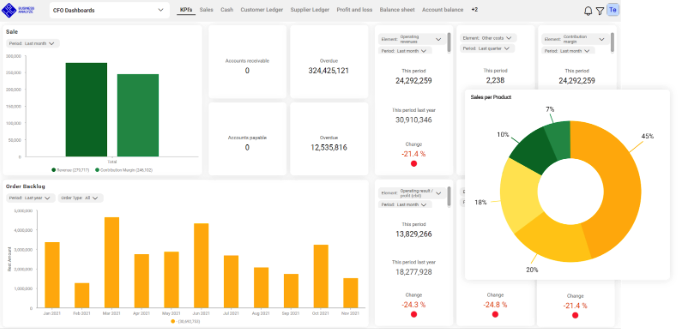
1. KPI Overview Dashboard
As the name says, the KPI overview dashboard lays out all critical CFO KPIs in one place to offer a bird’s-eye view of the company’s financial health.
Decision makers don’t have the time to wade through a 40-slide report just to know the company’s doing fine, and this CFO dashboard helps skip that hassle. It gives them that quick read that matters the most.
So if a number looks intriguing, CFOs can drill down further by moving into the relevant specific dashboards right from inside this dashboard.
And if company priorities shift in the future, CFOs can add new financial KPIs or remove the less relevant ones from the view.
2. Profit and Loss Dashboard
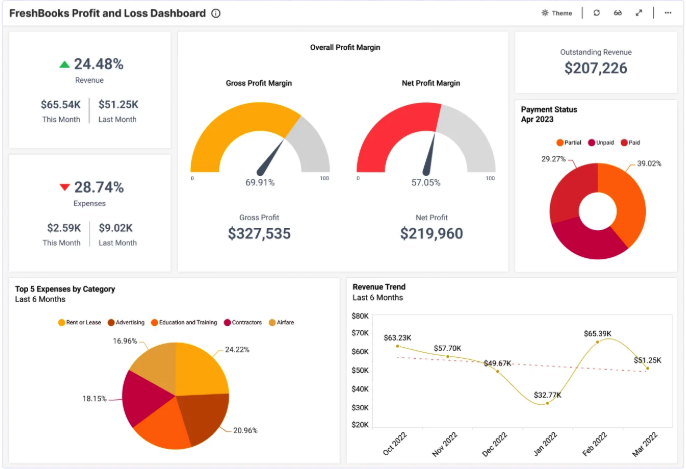
Simply put, this financial KPI dashboard tells you whether all those long nights and budget meetings are actually paying off.
It offers a summary of revenue, expenses, and overall profit over a given period and helps CFOs answer the big questions like:
- Are we going to hit our profit targets next quarter?
- Do we have enough cash flow for our expansion plans?
- Can we afford to pay dividends at the end of the year without any hurdle?
CFOs can also use the dashboard for diagnostics. For instance, they can drill into departmental spending to see where costs are ballooning and where profits are slipping through the cracks (or vice versa).
3. Expense Management Dashboard
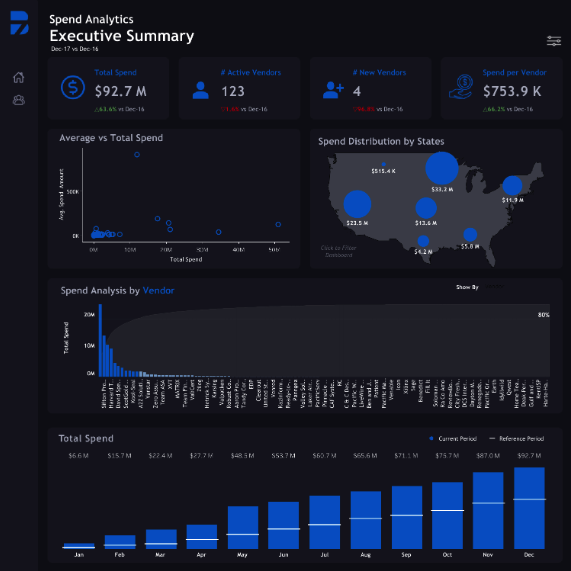
Every dollar spent across departments shows up in the expense management dashboard, broken down by category, so CFOs can see things like whether marketing went a little overboard or operations somehow found a way to spend under budget (a rare miracle, but it happens).
Only through this dashboard, CFOs will be able to catch if a certain department consistently overshoots its budget so they can fix it before it causes irreversible damage.
Besides overspending instances, this dashboard can also highlight opportunities for cost savings.
4. Forecast Dashboard
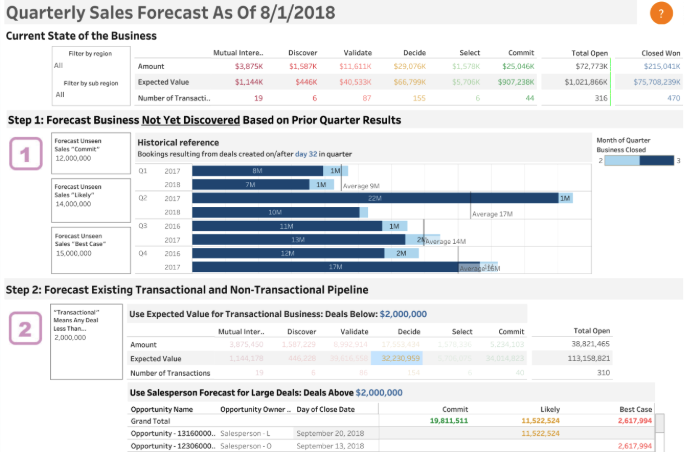
While most other CFO dashboards and reports show what’s already happened, the forecast dashboard projects the future so CFOs start planning ahead.
It uses historical data and predictive analytics to project future CFO KPIs like revenues, expenses, and profits, among others.
The dashboard updates every quarter with fresh data.
You can also run scenario comparisons too, to test base, optimistic, and pessimistic cases to see how different factors might play out.
5. Actual vs. Forecast Expense Dashboard
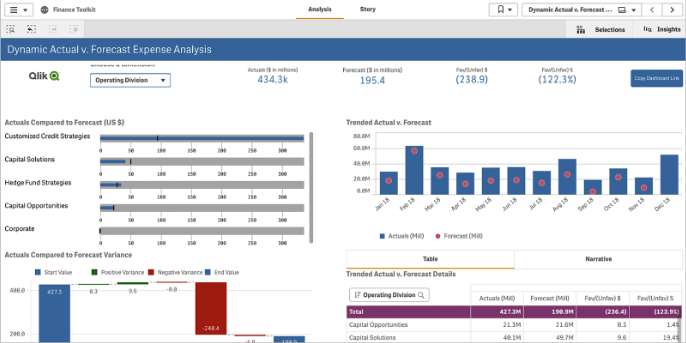
The actual vs. forecast expense dashboard provides a side-by-side view of how actual expenses stack up against what was forecasted for a given period.
Whether spending is within range or it’s surging above expectations, CFOs and finance teams will be able to spot both this and the “why” behind those shifts.
Typically, the dashboard includes actuals, budget, and variance values shown both in numbers and percentages. It can also have color-coded thresholds to make it easy for the board and senior leaders to grasp the current situation of the business.
If you don’t want to leave certain numbers, say deviations, open to assumption, you can add commentary fields to write explanations.
6. Cash Flow Dashboard
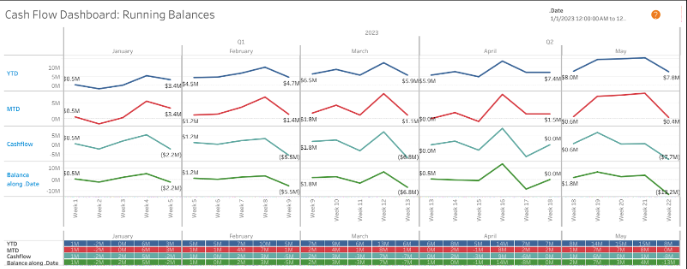
The cash flow dashboard is among the most practical CFO dashboard examples for its ability to keep finance leaders ahead of liquidity issues.
The dashboard pulls data from customer and supplier ledgers to provide a real-time view of cash inflows and outflows.
Want to track accounts receivable, accounts payable, monthly turnover per department, net cash flow, future inflows, or outflows? Head to this dashboard.
Typically, the dashboard includes visual indicators, like gauges showing the average number of days it takes for invoices to be paid, both incoming and outgoing. Click into those gauges, and you can see how those numbers have trended month to month.
7. Customer Ledger Dashboard
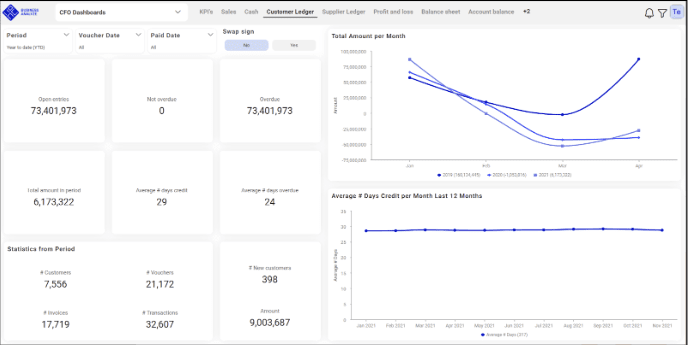
The customer ledger dashboard gives visibility into all customer-related financial activity at both an aggregated and individual customer level.
The dashboard has filters that you can apply to help you summarize data.
For example, you can filter data by invoice date, due date, or statement date, or you can check open entries or review how many new customers have joined during a specific period..
Customer specific metrics like average days credit and average days overdue are also tracked inside this dashboard.
How to Choose the Right CFO Construction Dashboard
To choose the right CFO construction dashboard(s), the first question to answer is what unique financial challenges and goals your company faces. For instance, do you need better cost control on projects or a clearer view of customer acquisition costs?
When you’ve decided on that, determine the right set of CFO KPIs relevant to your specific business and projects.
Next, look for a dashboard builder tool, preferably made for your construction industry, that offers easy drag and drop functionality.
The tool must also connect seamlessly with your existing accounting software and provide customizable reports and visualizations.
Finally, evaluate potential tools based on their proven track record in the construction industry and their ability to support your company’s growth strategies, like acquisitions.
FAQs
What Is The Difference Between A CFO Dashboard And A CFO Report?
A CFO dashboard is a real-time visual that gives a quick overview of key financial metrics and trends. A CFO report is a detailed, static document usually created monthly or quarterly that includes full financial statements, supporting schedules, and in-depth analysis.
How to measure CFO performance?
CFO performance can be measured by looking at how effectively they manage the company’s financial operations and respond to challenges.
Some CFO performance metrics to evaluate a CFO are:
- How quickly do they close the books after the month-end
- How clearly they explain changes in profitability or costs
- How well they manage their team, including employee retention
If a CFO is under performing, the next step is to identify weak areas and offer support to help them improve. However, if progress doesn’t follow, replacing the CFO may be necessary.
Create custom CFO dashboards with Anterra
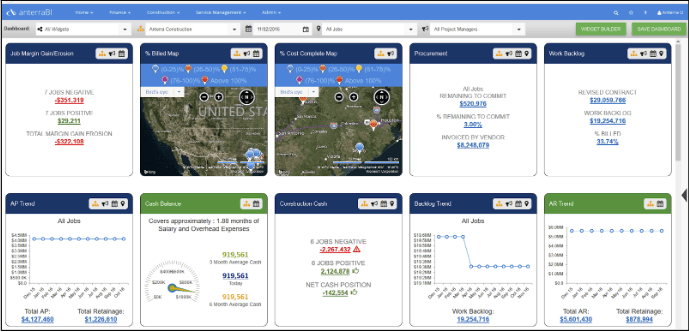
AnterraBI™ has pre-built and custom-built widgets to create and view dashboards.
You can build or edit a dashboard simply by opening the widget selection panel on the right and moving widgets wherever you want.
You can also remove widgets from a dashboard by clicking on the widget’s trash can icon.
Each dashboard is built around widgets that serve specific purposes. Finance widgets have green headings, and construction widgets have blue headings.
The list of available pre-built widgets and user-built widgets is listed by module on the right. If the widget you want isn’t available, AnterraBI allows you to build your own as well.
Once you’ve laid out your dashboard and filters, you can save your dashboard as either a shared dashboard, which makes it available to everyone, or as one of your own personal dashboards that only you can see.
Read our detailed guide on how to build your own dashboards with widgets or watch our YouTube video.
Schedule a free demo with Anterra and start building your first CFO dashboard!
